Building a Detection Foundation: Part 1 - The Single-Source Problem
Table of contents
The Uncomfortable Truth About Your Telemetry
Let me start with an observation that might hit close to home. In my years working Incident Response cases and running Tabletop Exercises, I've noticed a pattern that keeps showing up: organizations often rely on a single source of truth for their security telemetry. Most of the time, it's their Endpoint Detection and Response (EDR). Sometimes it's just their Antivirus (AV). When I ask about native Windows auditing, I usually get one of two responses—either 'we have it enabled' (with no clarity on what exactly is enabled), or a blank stare.
This isn't a criticism, it's just the reality of how environments evolve. EDR gets deployed because it solves an immediate problem. The vendor says it covers everything. And for a while, that seems true. Until it doesn’t.
That's what this series is about, building the logging foundation that exists independently of any single vendor or tool. We'll start with Windows Security events: the logon tracking and process execution telemetry that gives you session-level visibility into what's happening on your endpoints. From there, we'll move into PowerShell logging to close the gap on script-based activity, then layer on System Monitor (Sysmon) for the network connections, registry changes, and behavioral telemetry that native logging misses. Finally, we'll bring it all together and walk through how these data sources complement each other in real-world detection engineering and Incident Response. Each layer builds on the last, and by the end, you'll have a detection foundation that holds up even when your primary tools don't.
When Your Single Source Goes Blind
Here's the thing about relying solely on EDR: attackers know you're relying on it too. I've worked cases where the adversary's first move after getting a foothold was to tamper with or disable the EDR agent. They're not subtle about it anymore—they bring their own tools specifically designed to blind your visibility.
Let me share a war story that illustrates exactly why this matters.
The CACTUS Incident
Last year, we worked an Incident Response engagement against the CACTUS ransomware group. They had compromised the environment and deployed multiple techniques to disable not one, but two different EDR solutions across different locations. One of the methods involved a legitimate anti-cheat driver—signed, trusted, and completely effective at blinding the security tooling.
By the time we were engaged, the EDR was essentially useless for reconstruction. We couldn't see what they touched, where they moved, or what they deployed.
What turned the case around was something the customer had done right without necessarily knowing it would save them. One site had configured a robust Windows audit policy on their domain controllers. And, as luck would have it, the attackers used one of those domain controllers as a beachhead server to stage and distribute their tooling across the environment. The key event was Event ID 5140 (a network share object was accessed). This event includes the source that connected and what file was accessed.
Those logs on that single host gave us everything:
- Over a hundred systems the attackers touched during lateral movement
- Which systems had encryptors deployed
- Which systems had rclone staged for data exfiltration
- Which systems received C2 agents
We were able to build a file tree of the files accessed and a count. Then we could identify the specific files of interest and see if the tree had isolated and triaged the data exfiltrated from hosts.
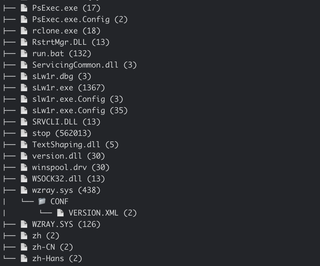
All of this was missed by the EDR—because the EDR wasn't running anymore. But the Windows Security event log? It was still writing to disk, capturing every logon, every process execution, every network share access.
That domain controller's logs became the Rosetta Stone for the entire investigation. Without them, we would have been reconstructing the attack from disk forensics alone, which is possible, but far more time-consuming and less complete.
This is what I mean by the single-source problem. If the answer to 'what do we fall back on?' is 'nothing,' you're going to have a very difficult investigation ahead of you. I like following the military axiom of 'One is none, two is one.
What the Data Tells Us
I recently pulled together coverage data from the MITRE ATT&CK framework to understand which data sources provide the most detection opportunities across known techniques. The results reinforced what experience had already taught me, but seeing the numbers laid out is useful for prioritization.
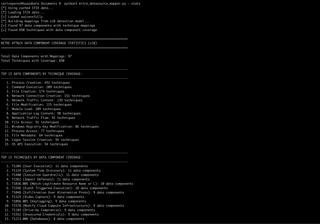
Here are the top 15 data components ranked by the number of ATT&CK techniques they can help detect:
Data Component | Technique Coverage |
|---|---|
Process Creation | 452 |
Command Execution | 209 |
File Creation | 174 |
Network Connection Creation | 151 |
Network Traffic Content | 139 |
File Modification | 115 |
Module Load | 109 |
Application Log Content | 98 |
Network Traffic Flow | 92 |
File Access | 91 |
Windows Registry Key Modification | 86 |
Process Access | 77 |
File Metadata | 64 |
Logon Session Creation | 56 |
OS API Execution | 54 |
Process Creation alone covers 452 techniques. That's not a typo. If you're not capturing process creation events with full command line arguments, you're blind to almost half of the ATT&CK framework from the start.
But this is why context matters—and why threat intelligence and operational experience have to inform how you prioritize these data sources.
The Pieces That Don't Show Up in Raw Numbers
Looking at that table, you might notice that Logon Session Creation only covers 56 techniques. You might be tempted to deprioritize it. That would be a mistake.
Here's why: Logon and logoff events are the connective tissue of Windows forensics. When a user (or attacker) logs on, Windows assigns a LogonID to that session. That LogonID then shows up across dozens of other event types—process creation, object access, privilege use, and more. It's the thread that lets you stitch together a narrative of what happened during a specific session.
But here's the catch: LogonIDs get reused. Without the corresponding logoff event (Event ID 4634 or 4647), you can't definitively scope when a session ended. This means you might mistakenly attribute actions from a later session to an earlier one if you're not careful.
Want to see how pervasive LogonID is across Windows Security events? Here's a quick way to check:
$secprovider = Get-WinEvent -ListProvider Microsoft-Windows-Security-Auditing

$secprovider.Events | Where-Object { $_.Template -like '*LogonId*' } |
    Select-Object Id, @{Name='Description'
        Expression={
            if ($_.Description -match '^([^\r\n]+)') {
                $matches[1].Trim()
            } else {
                $_.Description.Trim()
            }
        }
    } | Format-Table -Wrap -AutoSize
Run that on a Windows system and you'll see just how many events include LogonID as a field. That's the correlation potential you're leaving on the table if you're not capturing logon and logoff events.
The Foundation Mindset
What I'm getting at is this: building effective detection isn't about picking one tool or one data source and hoping it covers everything. It's about understanding what each source provides, where the gaps are, and how they work together.
Over the next four parts of this series, I'm going to walk through how to build a layered telemetry foundation that gives you real visibility—not vendor-promised visibility, but operationally-tested visibility. We'll cover:
- Part 2: Windows Security Events – The essentials that should be enabled by default but often aren't, including the audit policies that matter and why LogonID correlation is your forensic lifeline.
- Part 3: PowerShell and Script Logging – Command execution is the second-highest coverage data source for a reason. We'll configure PowerShell logging properly and discuss what you'll actually see.
- Part 4: Sysmon – Native Windows logging has gaps. Sysmon fills in many of them. I'll provide a practical configuration and explain the trade-offs.
- Part 5: Correlation in Practice – Having logs is one thing. Knowing how to use them during an investigation or when building detections is another. We'll bring it all together.
Assume the Worst, and Build for It
The goal here isn't to replace your EDR or to suggest that native logging alone is sufficient. Remember that the goals are redundancy and context. When (not if) something goes wrong—when the EDR is bypassed, when the attacker uses living-off-the-land (LOTL) techniques, when you need to answer 'what exactly happened at 3:47AM on that server?'—you want multiple sources of truth that can corroborate or fill in the blanks. Best believe that lawyers, executives, and others will be pressuring for answers, and the more you reduce the noise to answer accurately and quickly, the more you will help yourself stay ready, and armored, for the breach and its ensuing follow-up...
Let's build that foundation.