Windows Processes, Nefarious Anomalies, and You: Memory Regions

While operating on a red team, the likelihood of an Endpoint Detection and Response (EDR) being present on a host is becoming increasingly higher than it was a few years ago. When an implant is being initiated on a host, whether it’s on-disk or loaded into memory, then there is a lot to consider. In this post, we will focus on one very specific component of EDR: memory scanners.
A memory scanner is quite self-explanatory. It scans the memory of a process and attempts to identify non-standard attributes within a memory region in effort to determine if the process requires additional analysis and/or containment.
The community has done a great job of implementing memory scanners to identify malicious activity, and they have been adopted by red teamers as a means to QA their own implants:
For extra points, organizations could implement these into their own detection strategy – however, these types of tools look for very specific anomalies within a process, and because of that, may generate false positives.
In terms of EDR vendors, smaller components of these scanners will likely be in their toolkit, but they must undergo a lot of effort to ensure that false positives don’t make it into production, let alone customer environments. However, they are used for a slightly different purpose within an EDR—typically, when one of the memory scanner indicators is hit, it will trigger further analysis of the process. That could be known-malware signatures, log analysis for that particular process, and so on. An EDR is extremely unlikely to create an alert on an endpoint because RWX was allocated in a process. As we go into this series, we will show the sheer number of false positives that memory scanners can create when scanning everything. However, it may cause the EDR to take a further look into that process (as a naive example).
In this blog, we will look at what a memory scanner is looking at and why, and then we will identify some low-hanging fruit from a Command & Control (C2) implant.
1. Process Structure
In its simplest form, a process is an executing program. Under the hood, Windows is an object-oriented system. This means that each component of Windows will essentially boil down to sort of object. As for a process, the Windows Kernel knows this as the EPROCESS structure. However, going up a level, this structure is simplified to the Process Environment Block (PEB).
typedef struct _PEB {
  BYTE                          Reserved1[2];
  BYTE                          BeingDebugged;
  BYTE                          Reserved2[1];
  PVOID                         Reserved3[2];
  PPEB_LDR_DATA                 Ldr;
  PRTL_USER_PROCESS_PARAMETERS  ProcessParameters;
  PVOID                         Reserved4[3];
  PVOID                         AtlThunkSListPtr;
  PVOID                         Reserved5;
  ULONG                         Reserved6;
  PVOID                         Reserved7;
  ULONG                         Reserved8;
  ULONG                         AtlThunkSListPtr32;
  PVOID                         Reserved9[45];
  BYTE                          Reserved10[96];
  PPS_POST_PROCESS_INIT_ROUTINE PostProcessInitRoutine;
  BYTE                          Reserved11[128];
  PVOID                         Reserved12[1];
  ULONG                         SessionId;
} PEB, *PPEB;
From this structure, we can get information such as the process name, current directory, loaded Dynamic-Link Libraries (DLLs), and so on. This is the structure we will be working with a lot.
To simplify this quite a bit, we will focus on three components of a process:
- Memory regions
- Threads
- Loaded DLLs
To learn more about the PEB, "Anatomy of the Process Environment Block (PEB) (Windows Internals)" is recommended reading.
2. A Bit of Context
For a bit of context, the sample used for this demonstration is going to be an unreleased/proof-of-concept C2 for the Maelstrom series, as it contains embedded indicators of compromise, which is perfect for this demonstration.
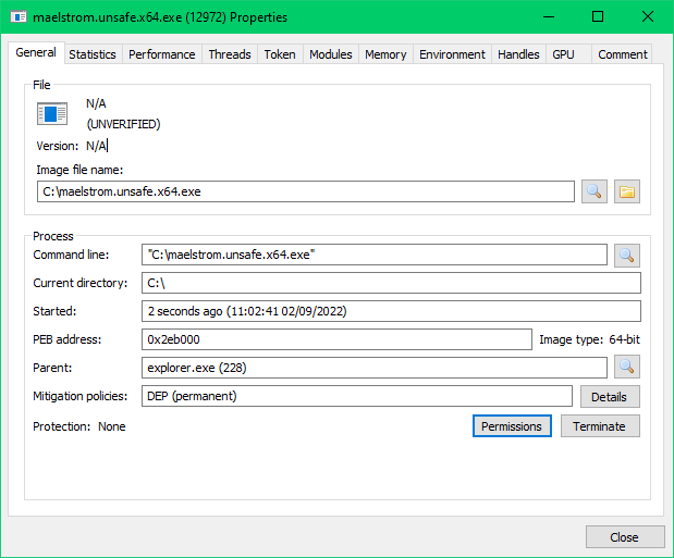
This reaches out to a local IP address, requests a Reflective DLL, and then executes it within memory. We will be searching for that final step.
One final note: The framework being used in this article to assess the process will not be released, but we will do our best to supply source code to achieve each component of this blog. The tool in question is known as Fennec and will be addressed as such throughout.
3. Enumerating Memory Regions
Using explorer.exe as an example, let’s use Process Hacker to look at the memory regions. This is done by finding a process, double-clicking and going to the Memory tab.
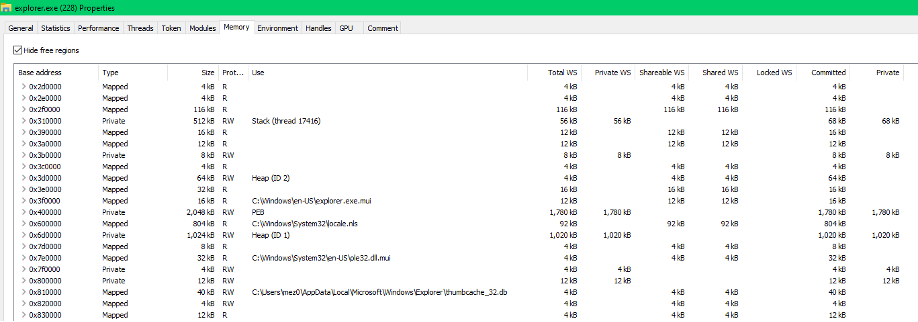
The way to achieve this programmatically is the VirtualQueryEx call.
SIZE_T VirtualQueryEx(
  [in]           HANDLE                    hProcess,
  [in, optional] LPCVOID                   lpAddress,
  [out]          PMEMORY_BASIC_INFORMATION lpBuffer,
  [in]           SIZE_T                    dwLength
);
This takes in a few arguments:
- Handle to the process
- A base address to query
- A pointer to a structure
- The size of the previous parameter
The most important part in this call is what we are expecting to get out of it: MEMORY_BASIC_INFORMATION.
 typedef struct _MEMORY_BASIC_INFORMATION {
  PVOID  BaseAddress;
  PVOID  AllocationBase;
  DWORD  AllocationProtect;
  WORD   PartitionId;
  SIZE_T RegionSize;
  DWORD  State;
  DWORD  Protect;
  DWORD  Type;
} MEMORY_BASIC_INFORMATION, *PMEMORY_BASIC_INFORMATION;
This structure will essentially create most of the regions found in the screenshot of Process Hacker, and this will give us 99% of the information required to analyze a processes memory!
As the scanner we will be producing has an extra member, and to allow for expansion later, a new structure is defined.
typedef struct REGION_
{
      LPVOID BaseAddress = nullptr;
      LPVOID AllocationBase = nullptr;
      WORD PartitionId = 0;
      DWORD Size = 0;
      DWORD ActiveProtect     = 0;
      DWORD InitialProtect = 0;
      DWORD State = 0;
      DWORD Type = 0;
      std::string Use = "";
} Region;
In this case, the Use will hold the DLL associated with the region, IF it exists.
One final thing before we work through all the regions—let’s make a quick note on each of the structure members we actually need:
- Base Address: The base address of the memory region
- Allocation Base: The base address of a range of pages which are created by VirtualAlloc
- Region Size: The size of the region beginning at the base address of all pages
- State: Whether it’s committed, freed, or reserved
- Active Protection: The access protection of the region as of access
- Initial Protection: The protection it was originally allocated as
- Type: Whether it’s private, image, or mapped memory (more on this later)
- Use: The reason that the region exists
Each of the structures defined will be put into a vector (array of objects). Here is the function to query each region, incrementing by the current region's size. Then, we build out the region structure and add it to the vector.
std::vector<FENNEC::Processes::Region> FENNEC::Processes::GetAllRegions(HANDLE hProcess)
{
    std::vector<FENNEC::Processes::Region> Regions;
    MEMORY_BASIC_INFORMATION mbi = { 0 };
    LPVOID offset = 0;

    while (VirtualQueryEx(hProcess, offset, &mbi, sizeof(mbi)))
    {
        if (mbi.RegionSize > 0)
        {
            offset = (LPVOID)((DWORD_PTR)mbi.BaseAddress + mbi.RegionSize);
            FENNEC::Processes::Region Region;
            Region.BaseAddress = mbi.BaseAddress;
            Region.AllocationBase = mbi.AllocationBase;
            Region.PartitionId = mbi.PartitionId;
            Region.Size = mbi.RegionSize;
            Region.ActiveProtect = mbi.Protect;
            Region.InitialProtect = mbi.AllocationProtect;
            Region.State = mbi.State;
            Region.Type = mbi.Type;
            Region.Use = FENNEC::Processes::GetRegionUse(hProcess, Region);

            Regions.push_back(Region);
        }
    }
    return Regions;
}
As for the GetRegionUse, this is simply a wrapper around the following function.
std::string FENNEC::Processes::GetModulePath(HANDLE hProcess, HMODULE hModule)
{
    CHAR Path[MAX_PATH];
    if (K32GetModuleFileNameExA(hProcess, hModule, Path, sizeof(Path) / sizeof(CHAR)))
    {
        return std::string(Path);
    }
    else
    {
        return "";
    }
}
GetModuleFileNameExA takes in a handle to a process and a module (base address), then attempts to retrieve its name. If this succeeds, then the region has a 'use'. This means that the memory region is attributed to something. We can demonstrate that.
In the following screenshot, we can see the memory regions of WINWORD.EXE, and there are two things to note.
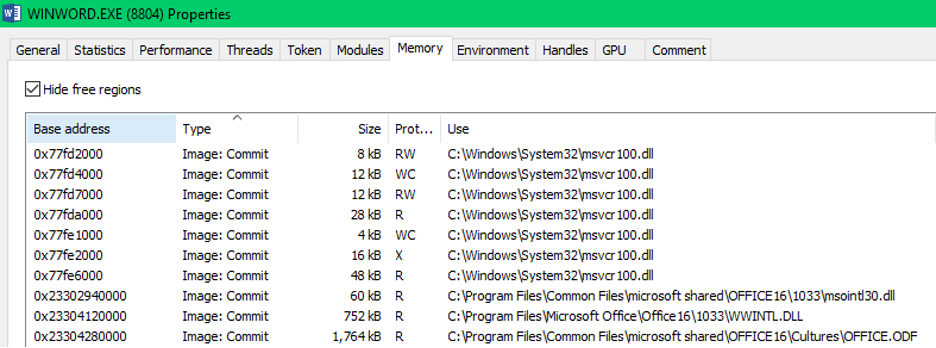
First of all, the Use column is filled with various DLLs. Secondly, the memory type is Image: Commit (MEM_IMAGE).
When a DLL is loaded into a process, its memory region will be a mapped image (MEM_IMAGE), and the base address will be that of the DLL—that is where the Use comes from, and that is what we are replicating above.
As an example, one of the structures would appear as follows.

With that, the enumeration section is done for now. Up next, parsing it for badness.
4. Identifying Malicious Attributes in Memory Regions
There are many ways to filter through memory regions to mark them as malicious. In this blog, we will look at two low-hanging fruits— RWX and MZ headers in private memory Regions—to ensure that this blog does not go on too long.
4.1. PAGE_EXECUTE_READWRITE
Out of all the techniques mentioned in this blog, this is the easiest to identify. And like the rest of the techniques, if the memory scanner detects any of these techniques, it does not necessarily mean they are malicious—it is just a potential indicator for further enumeration.
Below is the code to check for RWX.
void Scanner::HuntRWX(std::vector<FENNEC::Processes::Region> Regions, FENNEC::Comms::Common Common)
{
	for (FENNEC::Processes::Region& Region : Regions)
	{
		if (Region.ActiveProtect == PAGE_EXECUTE_READWRITE)
		{
			nlohmann::json Json;
			Json["method"] = "RWX";

			Json["base_address"] = FENNEC::Strings::LPVOID2StringA(Region.BaseAddress);
			Json["use"] = Region.Use;
			Json["allocation_base"] = FENNEC::Strings::LPVOID2StringA(Region.AllocationBase);
			Json["partition_id"] = std::to_string(Region.PartitionId);
			Json["region_size"] = std::to_string(Region.Size);
			Json["region_protection_active"] = FENNEC::Strings::ProtectToString(Region.ActiveProtect);
			Json["region_allocation_initial"] = FENNEC::Strings::ProtectToString(Region.InitialProtect);
			Json["region_state"] = FENNEC::Strings::AllocateToString(Region.State);
			Json["region_type"] = FENNEC::Strings::TypeToString(Region.Type);

			std::string Log = FENNEC::Comms::ConvertCommonLogStructureToJson(Common, Json);
			FENNEC::Logger::Good("RWX Identified: %s\n", Log.c_str());
			FENNEC::Logger::WriteLogToFile(LOG_TYPE, Log);
		}
	}
}
Essentially, we check if the ActiveProtect member of the structure is PAGE_EXECUTE_READWRITE—simple.
Then we run the scanner.

Beautifying the JSON, here is the full log.
{
  "data": {
    "allocation_base": "0x00000000001E0000",
    "base_address": "0x00000000001E0000",
    "method": "RWX",
    "partition_id": "0",
    "region_allocation_initial": "PAGE_EXECUTE_READWRITE",
    "region_protection_active": "PAGE_EXECUTE_READWRITE",
    "region_size": "73728",
    "region_state": "MEM_COMMIT",
    "region_type": "MEM_PRIVATE",
    "use": ""
  },
  "event_category": "Memory Scanner",
  "event_time": "Tue Sep 6 10:07:34 2022",
  "guid": "e861eb49-08ab-427f-95d7-e8116475c1e8",
  "image_name": "maelstrom.unsafe.x64.exe",
  "image_path": "\\Device\\HarddiskVolume11\\maelstrom\\agent\\stage0\\bin\\maelstrom.unsafe.x64.exe",
  "parent_procecess": 12652,
  "process_id": 15372
}
This log structure is common amongst all techniques within the scanner, and it provides a lot of context that could aid in further analysis. For example, in this case, it was allocated as RWX and was not changed at all. However, if this was allocated as RW and made a switch to RX, then this could also be malware, as this is the process to which 99% of implants subscribe.
In the case of an EDR, checking for protection changes from RW to RX whilst on a memory scan isn’t performed too often. Adjusting the scanner to scan all processes, it produces 498 entries on the host.

Taking this one step further by checking this information out inside of ELK, we find there are quite a lot of processes that use RWX.
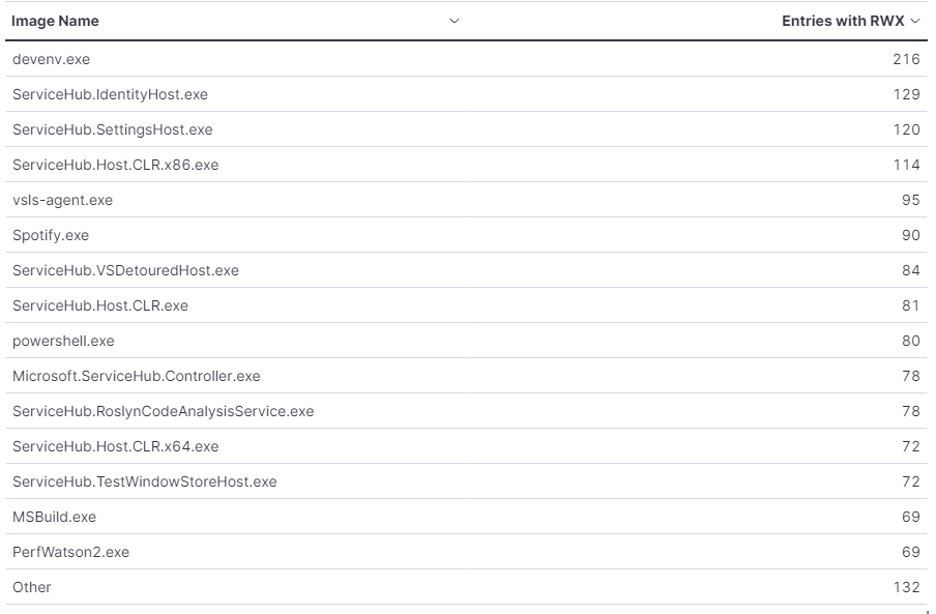
To clarify, the left column is the process name, and the right is the amount of log entries in which that process has RWX allocated.
4.2. MZ Headers in Private Memory Regions
This method is far less common, and a bit more complicated to understand. When a DLL is loaded, it gets marked as MEM_IMAGE, one of the types from MEMORY_BASIC_INFORMATION.
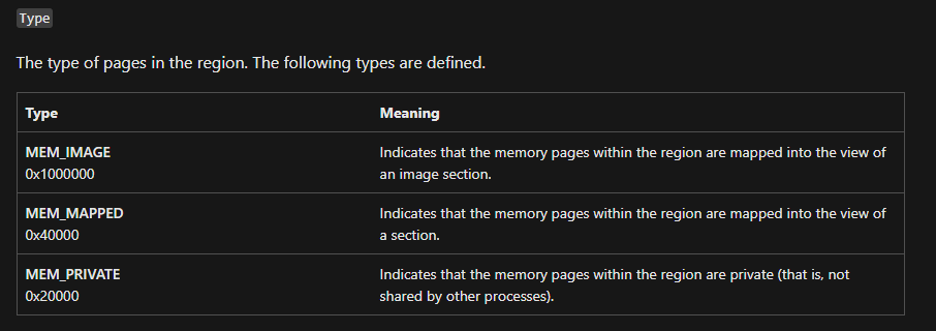
We can see this by opening up Process Hacker, finding a process, and navigating to the Memory section.
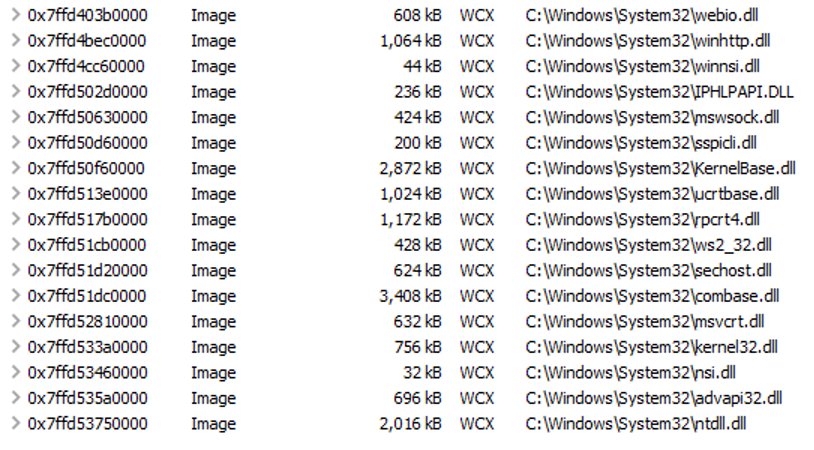
In this list, there will also be regions marked as mapped, which equates to the MEM_MAPPED type.
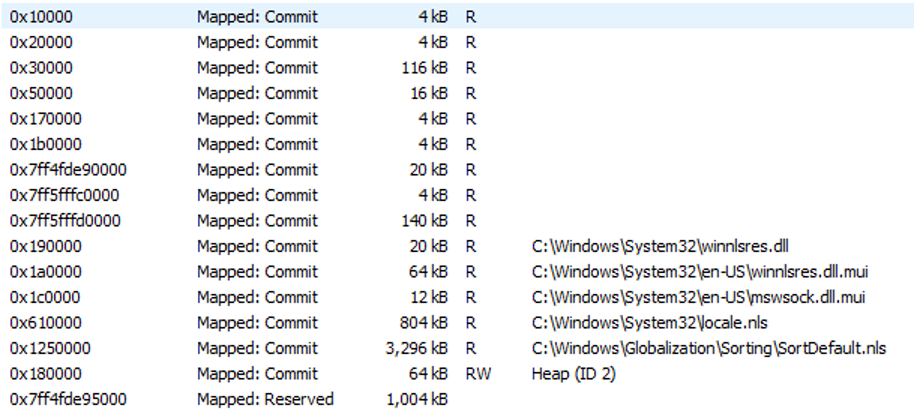
Looking at all the MEM_PRIVATE allocations, they tend to be regions used within the process/DLL for whatever they may need.
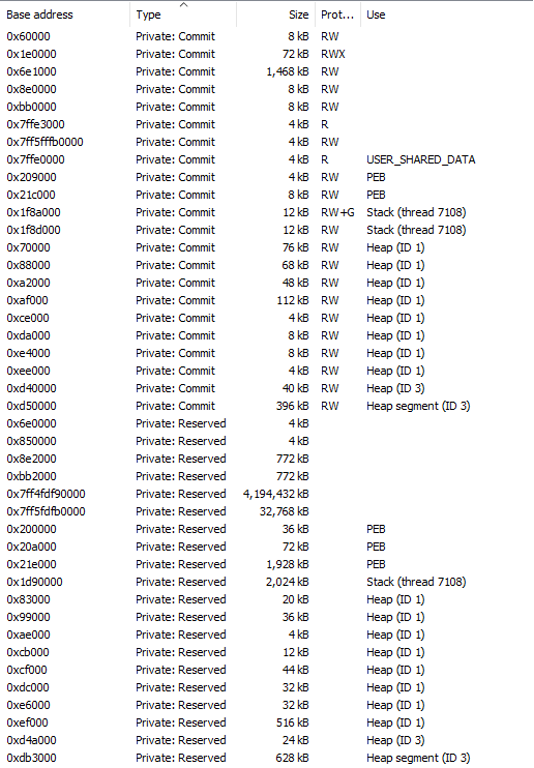
As an example, let’s allocate a big chunk of memory.
LPVOID pAddress = VirtualAlloc(nullptr, 409600, MEM_COMMIT | MEM_RESERVE, PAGE_EXECUTE_READWRITE);
	memset(pAddress, 'a', 409600);
Opening up the memory regions, we can see our allocation is Private Memory.

And then again with malloc (and a VirtualQuery so we can find where it is).
	LPVOID pAddress = (LPVOID)malloc(409600);
	memset(pAddress, 'a', 409600);

	MEMORY_BASIC_INFORMATION mbi = { 0 };
	VirtualQuery(pAddress, &mbi, sizeof mbi);
Here's the result.

As we can see in both cases, the memory is allocated as private, meaning that when ever memory is allocated within a process to do something with a buffer, a region like this will be created.
Therefore, if a DLL is found within this region, it’s extremely suspicious. If a genuine process needs a legitimate DLL, it will just load it appropriately—it will either load it at runtime as a dependency, or it will dynamically load it with something like LoadLibraryA.
Now that we understand why seeing a DLL in private memory is a bit weird, let’s look at how we identify this.
We begin by identifying all the memory regions as we did earlier and putting their structures into a vector. Now it’s time to parse.
The first thing we can do is disregard MEM_IMAGE and MEM_MAPPED. As this is more of a proof-of-concept, we don’t need to care about them. With that said, EDRs will respond differently to these types, and this kind of logic is extremely unlikely to occur. But we will do it for now.
if (Region.Type == MEM_MAPPED || Region.Type == MEM_IMAGE)
{
    continue;
}
Next, we define a few things that will be used.
BOOL bMzFound = FALSE;
BOOL bIsDLLBacked = FALSE;
std::vector<unsigned char> bytes = { 0x4d, 0x5a };
PCHAR lpBuffer = static_cast<PCHAR>(malloc(Region.Size));
Note the bytes vector. 0x4d and 0x5a are the hex values of MZ. We then allocate space into which we can read the entire region.
Using ReadProcessMemory, we then read the region.
BOOL bRead = ReadProcessMemory(hProcess, (LPVOID)Region.BaseAddress, lpBuffer, Region.Size, NULL);

if (bRead == FALSE)
{
      free(lpBuffer);
      continue;
}
In this example, we then get the first two bytes of the region and put them into a vector.
std::vector<unsigned char> vectorBuffer(lpBuffer, lpBuffer + 2);
By simply adding three 0s (000) to the start of the malicious region, this logic would be avoided.
With that, we compare the newly created 2-byte vector to the MZ vector.
BOOL FENNEC::Strings::CompareVectors(std::vector<unsigned char> a, std::vector<unsigned char> b)
{
	if (std::equal(a.begin(), a.end(), b.begin()))
	{
		return TRUE;
	}
	else
	{
		return FALSE;
	}
}
At this point, it could potentially be finished. But there is a bit more checking to do first, just to make sure.
If this returns a 'true' response, the scanner will validate if that region belongs to any DLL in the process. Not strictly required, but worthwhile. To achieve this, there are two methods.
First, we get every DLL in the process and compare base addresses.
	std::vector<FENNEC::Processes::Module> modules = FENNEC::Processes::GetModules(hProcess);
	for (FENNEC::Processes::Module& Module : modules)
	{
		if (Region.AllocationBase == Module.BaseAddress)
		{
			bIsDLLBacked = TRUE;
			break;
		}
	}
Or we can do this manually by parsing the PPEB_LDR_DATA structure.
BOOL FENNEC::PEBLOCK::IsBaseAddressWithDll(LPVOID BaseAddress)
{
	PPEB_LDR_DATA Ldr = FENNEC::PEBLOCK::Peb->Ldr;
	LIST_ENTRY* ModuleList = NULL;
	BOOL bDllIsBacked = FALSE;

	ModuleList = &Ldr->InMemoryOrderModuleList;
	LIST_ENTRY* pStartListEntry = ModuleList->Flink;
	for (LIST_ENTRY* pListEntry = pStartListEntry; pListEntry != ModuleList; pListEntry = pListEntry->Flink)
	{
		LDR_DATA_TABLE_ENTRY* pEntry = (LDR_DATA_TABLE_ENTRY*)((BYTE*)pListEntry - sizeof(LIST_ENTRY));
		std::wstring wsName(pEntry->BaseDllName.Buffer);
		std::wstring wsPath(pEntry->FullDllName.Buffer);

		std::string modName = FENNEC::Strings::StringW2StringA(wsName);
		std::string modPath = FENNEC::Strings::StringW2StringA(wsPath);

		if (BaseAddress == pEntry->DllBase)
		{
			bDllIsBacked = TRUE;
			break;
		}

	}
	return bDllIsBacked;
}
Either way, this will return a 'false' response, as the memory region is not the base address of a DLL.
Targeting the implant process, it identifies one region.

Here is the full log.
{
  "data": {
    "allocation_base": "0x00000000001E0000",
    "base_address": "0x00000000001E0000",
    "method": "Memory Allocation without DLL Backing",
    "partition_id": "0",
    "region_allocation_initial": "PAGE_EXECUTE_READWRITE",
    "region_protection_active": "PAGE_EXECUTE_READWRITE",
    "region_size": "73728",
    "region_state": "MEM_COMMIT",
    "region_type": "MEM_PRIVATE",
    "use": ""
  },
  "event_category": "Memory Scanner",
  "event_time": "Tue Sep  6 11:57:57 2022",
  "guid": "59cd7a5a-53aa-4ca8-91b4-d76e8feecab1",
  "image_name": "maelstrom.unsafe.x64.exe",
  "image_path": "\\Device\\HarddiskVolume11\\maelstrom\\agent\\stage0\\bin\\maelstrom.unsafe.x64.exe",",
  "parent_procecess": 12652,
  "process_id": 15372
}
As with RWX, this detection strategy is reporting a region. So, the structure above is exactly the same. However, this time the method has changed in the JSON.
"method": "Memory Allocation without DLL Backing"
If we run this scanner across every process on the host, only one region is hit.

We can verify this by opening Process Hacker and finding the region (0x00000000001E0000).
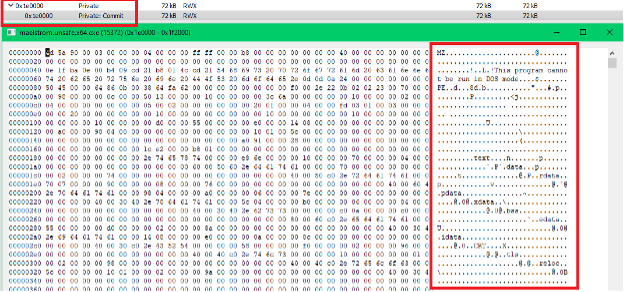
Comparing this to the RWX check, this is far more accurate and a much bigger indicator.
5. Conclusion
As far as this goes, tools such as pe-sieve are a lot better at detecting malicious activity with greater detail and are recommended tools if implant development is required. As for EDRs, some of the utility MAY be too performance intensive and aren’t likely to be used—however, attributes of this will be used and are often used as a basis to trigger further queries, rules, or scripts.