Oh, Behave! Figuring Out User Behavior

One topic that has always been of interest to me is how users actually use their computers. While TrustedSec does have the ability to understand a system when we encounter it, there are still mysteries around normal user behavior. Understanding user behavior becomes even more important when attempting to defeat next generation of EDRs that have AI bells and whistles, machine learning algorithms, awesome blue team signatures, and frickin' sharks with laser beams attached to their heads. I decided to embark on a journey to understand user behavior without knowing exactly how I would gather details about user activity as a research topic. A major component of this research is finding a way to gather data on user behavior without making too much noise or triggering detections in a live environment. Could I achieve this? I would really love to be able to land a shell on a box, execute a file, and immediately gain an understanding about user activity. I would love to see what the user executes and when they start and end their day.

When approaching this topic, my initial thought was that I would have to query the event log or leverage Event Tracing for Windows (ETW) somehow. After several unsuccessful attempts, I decided that this is probably not the way to go. I was either making too much noise or needed additional privileges. Diving deeper into Windows, I started to look at what telemetry was available regarding user behavior and discovered something really interesting in the form of the Windows Timeline. If you are not familiar with the Windows Timeline, this is something that was introduced with Windows 10 and shows recent computer activity. You can click on the Task View in the Start menu and have a look at it by scrolling down.
The icon looks like this:

When you scroll down on the list of open applications, it looks something like this:
This collection of information is controlled by turning on 'Store my activity history on this device,' which is found under Settings > Privacy > Activity History. From my research, it seems that this is enabled by default in Windows. This can also be manually configured by editing the file CDPGlobalSettings.cdp, found under
C:\Users\%username%\AppData\Local\ConnectedDevicesPlatform\
To enable the feature, set the PublishUserActivity to 0 and reboot the system. This is perfect if you, as an attacker, land on a box that does not have this feature enabled, but you want to collect the historical data later on.
But enough about how to enable this feature… where is the data? It turns out that the timeline data is stored in a SQLite database called 'ActivitiesCache.db,' which is found under
C:\Users\%username%\AppData\Local\ConnectedDevicesPlatform\<GUID>\
After looking at the content of the database using the SQLite browser (https://github.com/sqlitebrowser/sqlitebrowser) and doing some online searching, I stumbled upon some excellent research by Kacos2000. Looking through their repo, I found the answers to all of my questions regarding the Windows Timeline. They also created a number of tools and posted them on GitHub, which can be found here https://kacos2000.github.io/Wi.... The PDF document (https://kacos2000.github.io/WindowsTimeline/WindowsTimeline.pdf) was extremely helpful. Kudos to Kacos2000 for their awesome research on the topic and for saving me from expending many research hours.
I decided to repurpose a lot of the research gathered for my own end goals. I started by using the windowstimeline.exe utility to explore the data in more detail. This tool does some decoding (base64) and unpacks the JSON fields, making the information easier to review. Exploring the data shows many interesting columns. The columns I found most useful were App_Name, DisplayName, DisplayText, Description, AppActivityID, Content, ActivityType, Platform, StartTime, EndTime, Duration, TimeZone, Payload, and ClipboardPayload.
There are also a few PowerShell scripts in the repo that allow you to extract information from the database in a scripted manner. Since the PowerShell script did not meet all of my requirements, I ended up writing an internal TrustedSec version in Python that outputs what I need from the data. While I am not a data scientist, I decided to create some additional reports from the database, as well as various charts that visualize user behavior in an interesting way. I am not releasing the code yet, but I will share the look of my reports and provide a preview of my generated charts. I am in the process of building this out internally, but I wanted to share some of this knowledge so others can benefit from it as well.

Reports
The first report I created showed user activity per application. This report shows the total time the applications have been actively used and displays the usage in seconds.
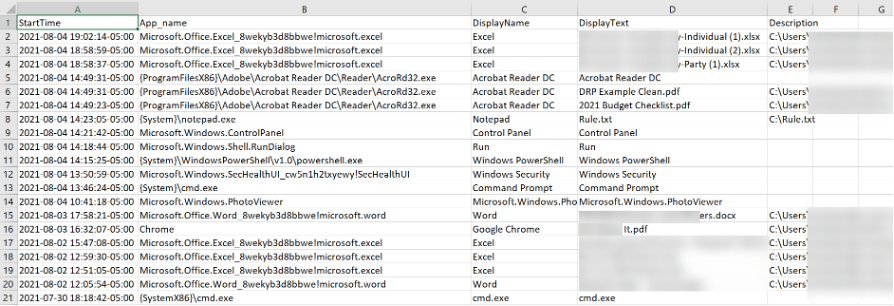
The second report I created shows when the different applications/binaries were launched and, if available, what parameters were used.
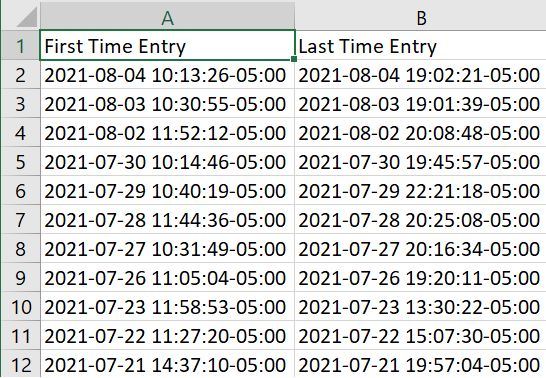
My third report shows the user's first and last timestamp entries for the day. This is useful for understanding the user's hours of operation.
Charts
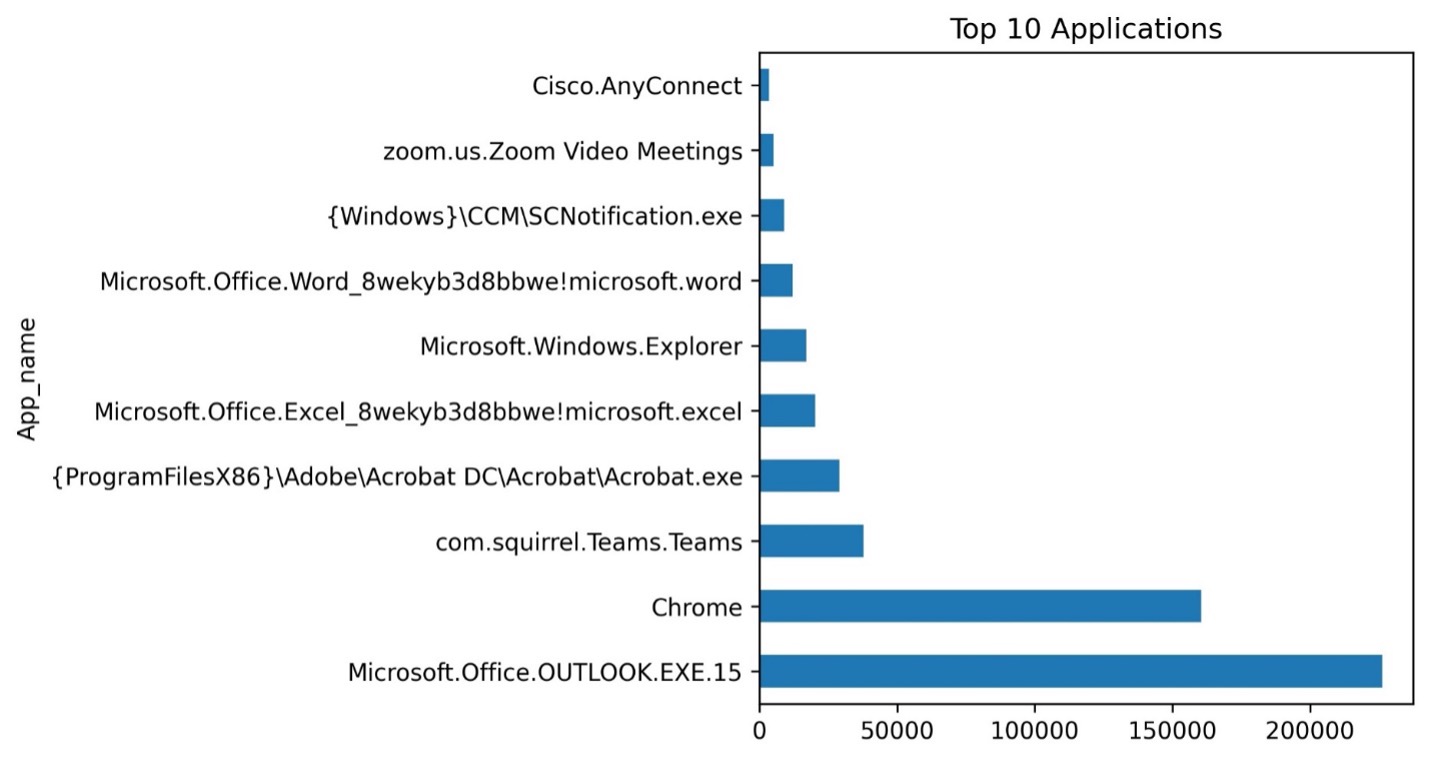
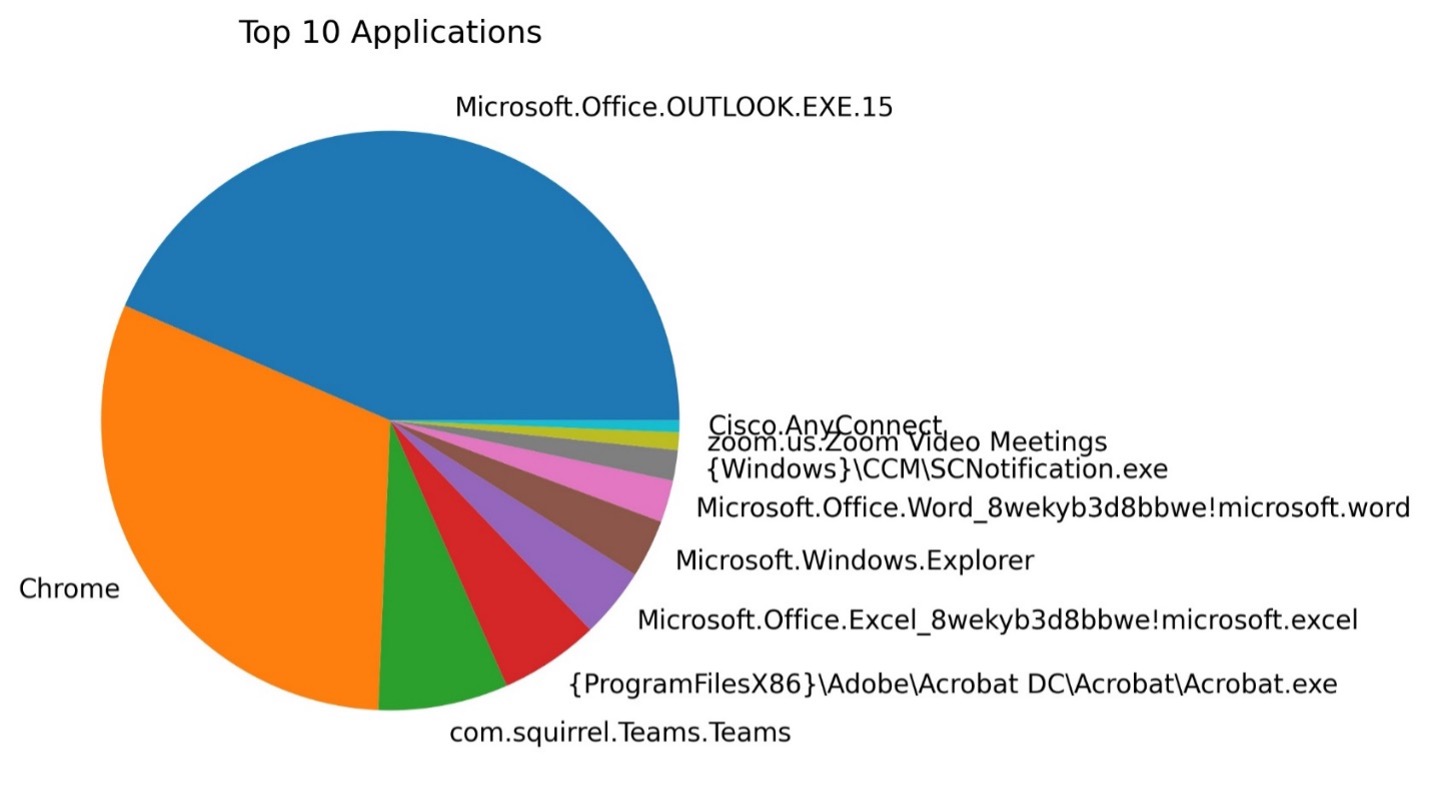
Reports are nice, but I wanted something I could use to easily understand typical behavior, so I created charts. I ended up creating four different chart types that show me what I need to know. The first two charts I created were about the top 10 applications used, with one in the form of a bar chart and the other a pie chart.
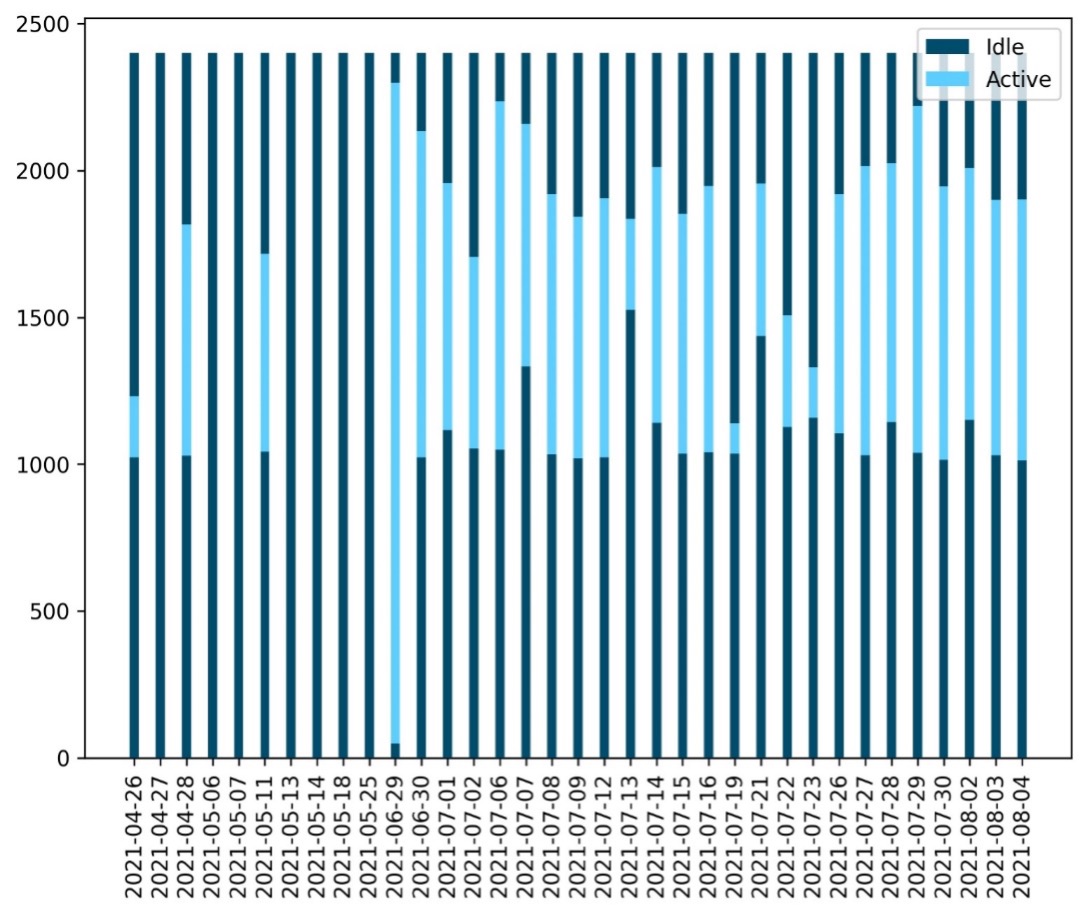
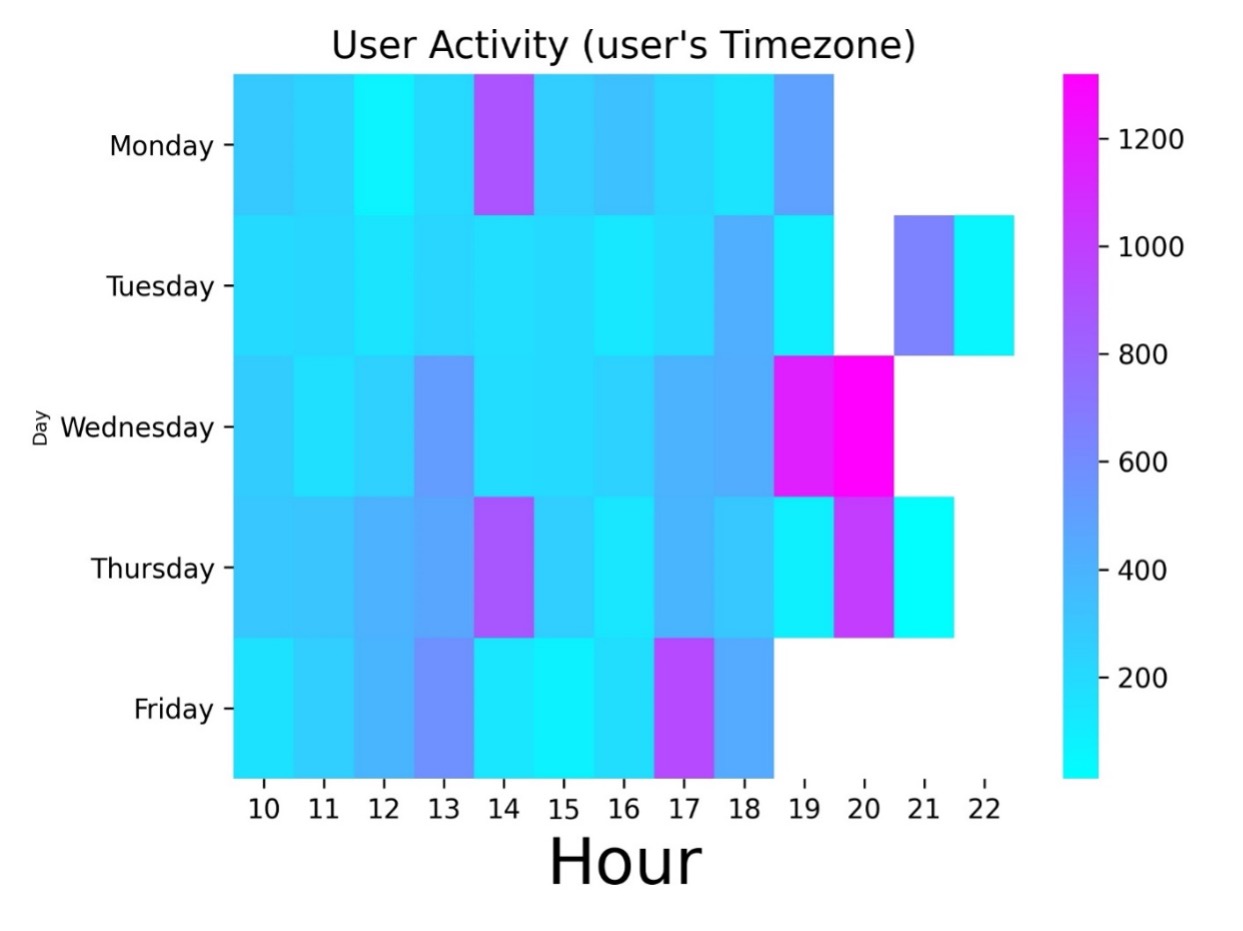
I also wanted an interesting way to display when the user was most active to help understand their normal operating hours. After a lot of exploring, I created a heatmap for days in a week and hours of the day, displayed as a bar chart showing idle and active time.
Outro
I have barely scratched the surface on the use of this data, as there is a lot of additional information to be extracted from this artifact. For instance, being able to list all of the documents that are currently being created (for backdooring/persistence purposes). However, I will leave other cases up to your imagination, as the data is there and can easily be used. My big win from this research was finding a rather silent way of retrieving user behavior and collecting useful data that can aid in future engagements. It amazes me that user activity is actually stored within a readable SQLite database file. I hope you enjoyed my little research adventure! Oh, and if you do try to bribe me for the internal python code… well, the price is set to

User-Behavior-Mapping-Tool released February 7, 2022: https://github.com/trustedsec/User-Behavior-Mapping-Tool